Exploring the Features of the New {talib} R Package for Financial Analysis
{talib} has officially launched as an R package, based on the well-known TA-Lib library, now available on CRAN. This is significant for both individuals and institutions engaged in technical analysis. The ease of use targeted by this package, while maintaining efficiency, could simplify workflows for a sector that often relies on complex and cumbersome tools.
Understanding {talib}
The design philosophy behind {talib} minimizes dependencies, promoting stability and flexibility for users who need reliable tools for data analysis. This approach can be especially valuable in fields like finance and trading, where data integrity and performance consistency are paramount. Tools that are over-reliant on external libraries may introduce performance bottlenecks or upgrade complications down the line. By reducing these dependencies, {talib} stands to offer a more dependable resource for analysts.
What sets {talib} apart is its seamless functionality with data.frame and matrix objects. Integration into existing workflows should be straightforward, allowing users less friction when adapting to new tools. Analysts often have entrenched methods for data manipulation; anything that reduces transition time while maintaining performance is worth paying attention to.
Performance Optimization
Performance was also a priority during development; each indicator efficiently connects with R’s C API using .Call(). This method is intended to execute tasks rapidly while minimizing memory usage. That's crucial when you're analyzing large datasets, as inefficient memory use could lead to lagging system performance or crashes. Given the extensive datasets trading professionals often work with, the promise of enhanced execution speed will certainly resonate.
Here's the thing: technical analysis often isn't just about having the right tools; it’s about how efficiently those tools work together. A package that executes quickly can lead to substantial time savings during analysis, especially when milliseconds can impact trading decisions. Keeping things performant will undoubtedly help {talib} stand out in a crowded field.
Charting with {talib}
The chart() function generates candlestick charts by default, offering immediate visualization capabilities. For instance, charting Bitcoin (BTC) is as simple as:
talib::chart(talib::BTC)
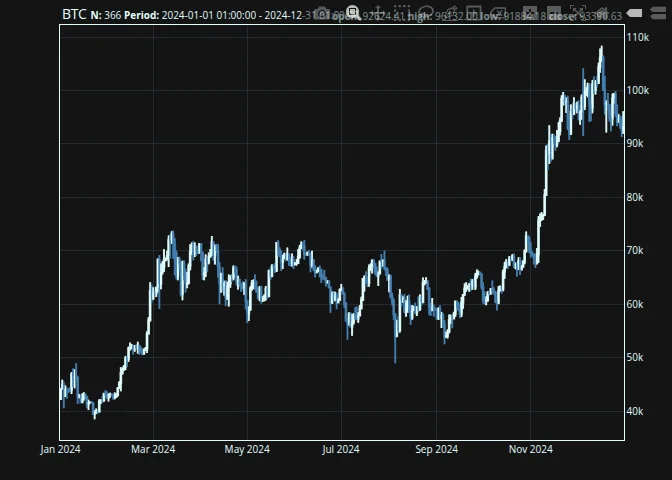
Effective visualization is a critical, often overlooked aspect of data analysis. The function's formal parameters allow for flexibility in how information is displayed. Options for symbol selection, chart types, and titles can help tailor visualizations to meet individual needs. This level of customization ensures that traders aren’t just working with raw data but can analyze movements in ways that make sense for them.
Customizing Chart Themes
Users can personalize their charts with different themes. One simple command can change the appearance, as shown below:
talib::set_theme("hawks_and_doves")
talib::chart(talib::BTC)
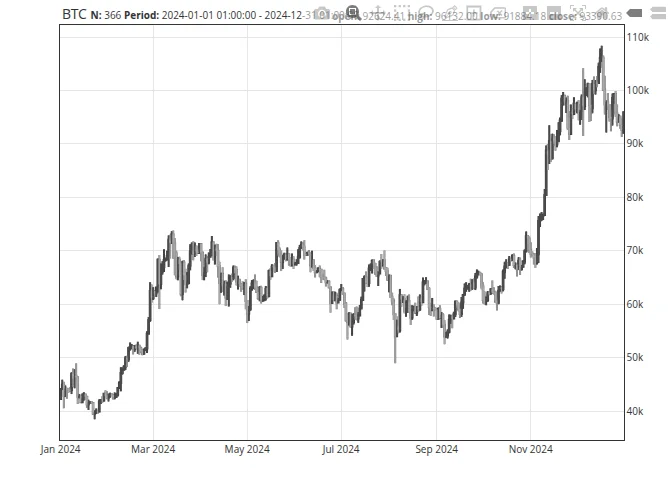
Customization is more than decorative—it's about creating an environment where analysts can focus on their work without distractions. If you're working in this space, you'll find that minor alterations to color schemes and visual styles can heighten your analytical experience significantly. It's these small adjustments that may ultimately affect how quickly users can discern patterns and make decisions.
Integrating Indicators
The package supports multiple technical indicators for enhanced analysis. Examples include Simple Moving Averages (SMA) and Trading Volume:
{
talib::chart(talib::BTC)
talib::indicator(talib::SMA, n = 7)
talib::indicator(talib::SMA, n = 14)
talib::indicator(talib::SMA, n = 21)
talib::indicator(talib::SMA, n = 28)
talib::indicator(talib::MACD)
talib::indicator(talib::trading_volume)
}
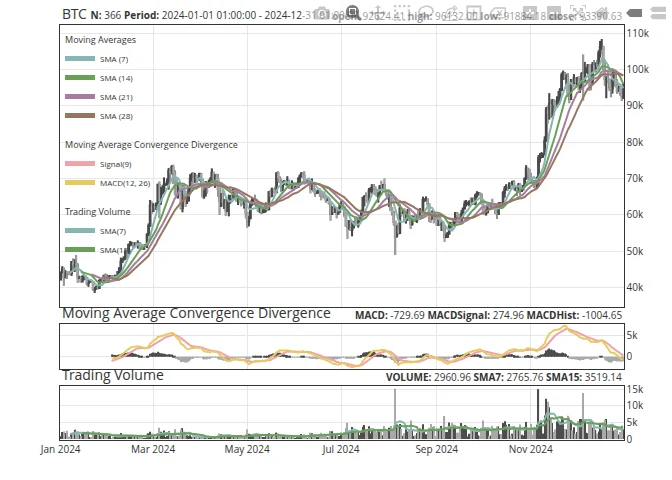
Technical indicators serve as foundational tools in trading but can be underappreciated in terms of how they inform market sentiment and future predictions. The novice might overlook their significance, but for seasoned traders, these indicators can be the difference between a winning and losing position. This package bundles some of the most essential indicators, enabling deeper analysis without needing to hunt for additional libraries or plug-ins.
Getting Started with {talib}
Installation is straightforward via CRAN. Users can set it up using:
install.packages("talib")
For those interested in fine-tuning performance or adapting the tool for specific needs, building from source can be particularly beneficial:
install.packages("talib", type = "source", configure.args = "-O3 -march=native")
This flexibility during installation adds another layer of appeal for performance-oriented users. Having options typically means better adaptability to various operational contexts—essential in the volatile world of finance.
Contribute to {talib}
{talib} remains in its early stages, and contributions are welcome. Whether through bug reports, suggestions, or coding, community involvement is encouraged. Access the repository at https://github.com/serkor1/ta-lib-R.
Implications and Future Outlook
The entry of {talib} into the R package ecosystem represents more than just another tool for analysis. It could shift how analysts approach technical evaluation—especially those who rely heavily on the R environment. This package is positioned to streamline workflows, potentially increasing productivity for users who find themselves bogged down by less efficient alternatives.
As trading environments become more competitive and data-driven, tools that enable speed and efficiency are likely to see high adoption rates. The community-driven aspect of {talib} may also enhance its growth trajectory, with early user input shaping its development and scalability. For institutions, this could mean less reliance on expensive proprietary solutions in favor of a flexible, customizable, and community-supported package.
In the long run, if {talib} can maintain consistency and reliability, it might just carve out a significant niche for itself as a preferred tool for technical analysis among R users. It’s a space to watch closely.
Created on 2026-04-29 with reprex v2.1.1